


Artificial Intelligence
Six Benefits of Open Source Software
6 min
In 2015, the United Nations introduced the Sustainable Development Goals (SDGs) for the year 2030. The SDGs agenda encompasses 17 goals aimed at addressing various global challenges, including poverty, inequality, climate change, environmental degradation, peace, and justice.
At the time, the UN proclaimed that making better use of data was an important focus area. This is where cartography comes in. Maps enable monitoring, understanding and planning for improvement in many SDG-related areas, and making them involves huge amounts of data.
From this starting point, UN and International Cartographic Association (ICA) scientists decided to join forces to provide guidelines for mapping geographic datasets related to the SDGs. These guidelines were compiled in a book titled "Mapping for a Sustainable World".
The following is a summary of that book's first section, which introduces the SDGs and their relation to geospatial data, as well as the implications for mapmakers.
The 17 general SDGs are divided into 169 more specific targets to be achieved for a sustainable world. As of April 2020, 231 unique indicators are used to measure and monitor progress towards each target, to inform policy, and to ensure accountability of all stakeholders. Reliable geospatial data and Earth observations are indispensable for this indicator framework to produce the desired results.
Once transformed into insightful maps, these types of data can serve to effectively communicate SDG challenges and successes to improve global awareness.
Now, what exactly is geospatial data? In layman's terms, geospatial data describes aspects of the natural and built environments. It has three components: location, attributes, and time.
In the case of the SDGs, datasets are reported for a country or region (location), contain multiple indicators for each goal (attributes), and are gathered across multiple years (time).
Location is about the where of geospatial data. For instance, the United Nations Headquarters can be localized at 405 East 42nd Street, New York, NY, 10017, USA. When using geographic coordinates, the address would be 40°44’34.79”N (latitude) and 73°58’2.99”W (longitude).
Location data is a complex topic for several reasons. First, it can be both relative (e.g. directions from another location) and absolute (e.g. geographic coordinates). As absolute coordinates often misalign due to different origins, compiling global location data often requires painstaking georeferencing and conversion before mapping.
Second, when a vector data model is used, the result may be a collection of either points (nodes only), lines (nodes and connecting arcs), polygons (enclosed nodes and arcs), or volumes (3D objects). The appropriate dimension for mapping depends on the map's purpose, scale, and level of detail.
A final complicating factor is spatial autocorrelation, i.e. the fact that nearby locations are more likely to be similar than distant locations.
The regional groupings to monitor SDG progress are based on the geographic regions defined under the Standard Country or Area Codes for Statistical Use, also known as the M49 standard. For the purpose of presentation, the SDG regional groupings combine specific M49 geographic regions and sub-regions.
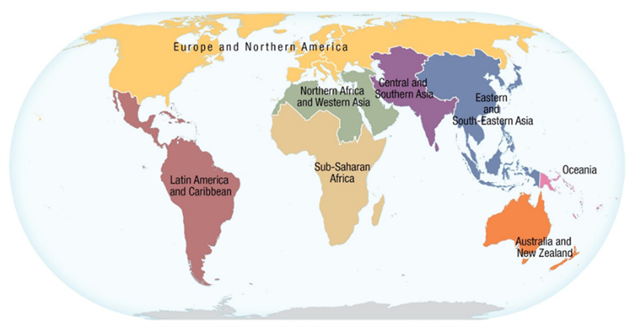
The SDG regional groupings are used to compile and report indicator data. Kraak MJ et al. (2020)
Attributes describe what or who is represented in geospatial data. They are either qualitative or quantitative.
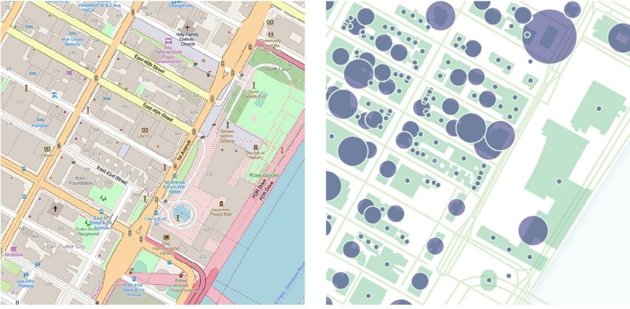
Left: A qualitative attribute: land use around the UN Headquarters (Source: OpenStreetMap).
Right: A quantitative attribute: building heights around the UN Headquarters. Kraak MJ et al. (2020)
Attributes come in two forms. Individual-level attributes describe unique conditions or qualities of a specific place (e.g. the tax rate applied for an entire administrative unit). Enumerated attributes deal with individual data within a predefined space (e.g., the population within a country). Most of the SDG indicators are enumerated.
Attributes are collected on one of four levels of measurement. Ratio data is quantitative, and the values are counted or calculated from a meaningful zero value (e.g. the number of inhabitants for each country). As with location data, ratio attribute data can be both absolute and relative.
Interval data is also quantitative, but the zero value is arbitrary (e.g. temperature measured in Celsius). Ordinal data describes non-numerical ranking, such as first-to-last, high-to-low, or good-to-bad.
Finally, nominal data refers to unranked categories, such as the M49 delineation of countries into different geographic regions, sub-regions, and intermediate regions.
Absolute ratio attribute data is often described as "raw" data and needs to be converted to relative attribute data to be useful. This process is called normalization.
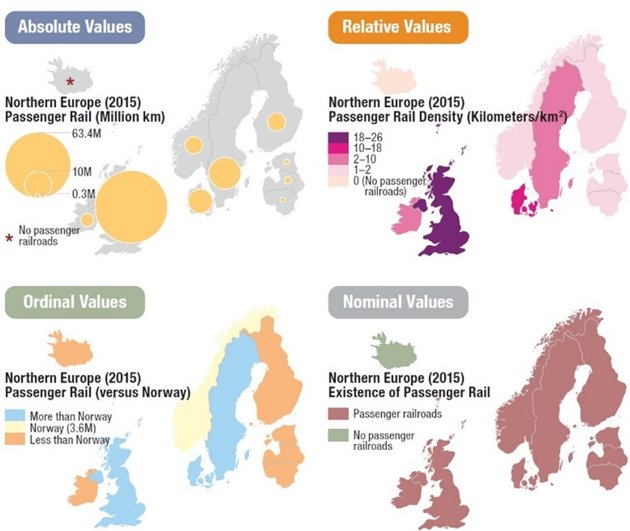
Maps produced from transforming absolute ratio values to relative ratio, ordinal, and nominal values. Kraak MJ et al. (2020)
Time is about when an event occurred at the specified location or when the data was collected. Spatiotemporal data can depict geographic changes, trends, and underlying processes.
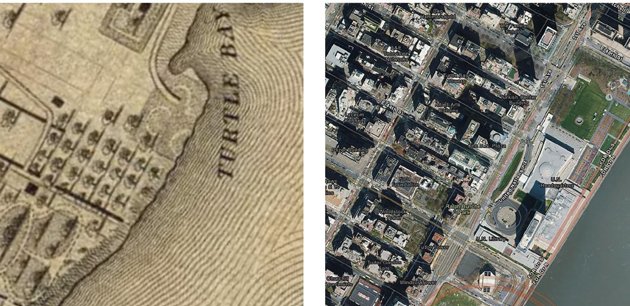
Left: The area around the UN Headquarters in 1836 (Source: Joseph Colton, Smithsonian
Magazine). Right: The same area today (Source: Google Maps). Kraak MJ et al. (2020)
Temporal data can be absolute or relative. Calendars and clocks measure absolute time; for example, the event occurred at 08:00 or lasted between 7 and 16 July.
Relative time describes an event or period compared to others; for instance, the event happened after dinner or before the start of summer.
Absolute temporal data can be either linear, where events proceed in regular succession without repetition, or cyclical, where sequences of events repeat forever.
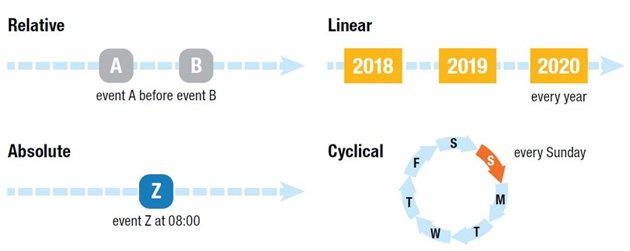
Left: Absolute versus relative time. Right: Linear versus cyclical time. Kraak MJ et al. (2020)
Mapping often aims to show changes over time, enabling an understanding of spatiotemporal patterns and trends. That's why the United Nations updates SDG indicator data annually to produce a linear time series of geospatial data on the same attribute.
Classification is the process of grouping map features by simplifying data. It’s meant to make maps more communicative, but on the other hand, it can also bring uncertainty.
How the lines are drawn between categories can affect the map's appearance. Cartographers need to make choices based on factors like how they want to emphasize certain parts of the data and how many categories they want to be represented. For SDG maps, where data can vary widely, different classification methods are used depending on the distribution of the data.
This Geoversity story is the first in the series Mapping for a Sustainable World. Come back soon for the next instalment.
This article has been adapted from Kraak MJ, RE Roth, B Ricker, A Kagawa, and G Le Sourd. 2020. Mapping for a Sustainable World. United Nations: New York, NY (USA). The original work is an open access document according to the CC BY-NC license
Login and start learning!