Land Administration Systems
Promoting sustainability with efficient land management
6 min
Earth Observation (EO) Scientists often create maps that classify an image as a certain class.
Some want to map forest cover to understand if deforestation is increasing over time. Others map the location of natural disasters (e.g. floods, landslides) to help decision-makers prioritize where to send aid.
Whatever the end product is, EO scientists need a good way of communicating how accurate their product is at identifying the class of interest. This process is known as an accuracy assessment.
This article will introduce you to accuracy assessments and direct you towards an online course showing you how to use a free online assessment tool.
The concept of an accuracy assessment is simple.
First, you collect information about the actual ground conditions at various locations (called samples) within your study area.
Then, you compare this actual (aka reference) classification to the classification according to your map.
This reference data is then compared to the map data and each sample. You can then use statistics to assess the accuracy of your product and communicate this to the end users of your map. Simple, right?
The catch is that how we distribute the samples and how many samples we collect information for can change the values we calculate, so how we distribute our samples is important.
Let's learn more about the terminology associated with accuracy assessments. An accuracy assessment has four components: sampling design, response design, selection protocol, and statistical analysis.
The sampling design is the manner of distributing your samples. When creating your sampling design, you must answer the following questions:
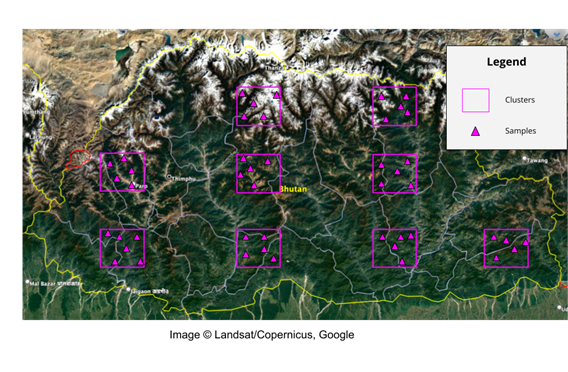
A cluster is a region within which we distribute our samples. EO scientists employ a clustered sampling design when it is not feasible to collect reference data everywhere in the area of interest. Thus, they distribute clusters within the region where they can collect reference data and then distribute the samples within those clusters.
The main reason for cluster sampling is to reduce the cost of data collection, as field visits or commercial imagery – often used to obtain reference classifications – can be expensive. The below image shows an example of a clustered sampling approach, where the clusters are shown in rectangles, and the samples are shown in triangles.

EO scientists sometimes use strata – discrete groups of pixels into which one pixel can be assigned – in the sampling design.
Stratification is often used by EO scientists to (1) report different statistics for different subpopulations of the data and (2) to improve the precision of the accuracy and area estimates given by the statistical analysis.
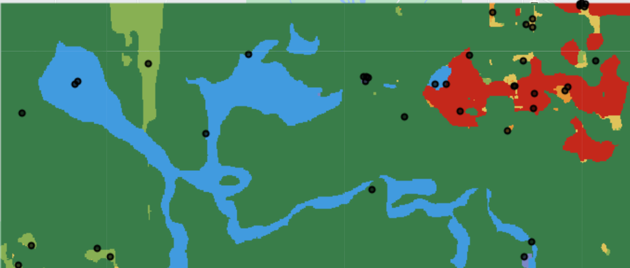
Stratification often uses land cover class as the strata when assessing a land cover map. The image below shows a representation of a stratified sampling design where the different colours represent different strata and the black circles represent the samples. Blue represents water, light green represents grasses, and red represents built-up.
Do you see how even though grassland is rare in our area of interest, some samples are still allocated to it?
If we just randomly distributed samples in our area of interest, we might not get any samples for the grassland class. This is exactly what makes stratification attractive to EO scientists. It allows us to get information about classes that are rare in the landscape, so we are confident that our statistical analysis helps us draw conclusions about all of our classes, not just the popular ones.

Map data: 2024 © Google
The selection protocol refers to how you distribute your samples within your strata and/or clusters (or your area of interest if you use neither strata nor clusters). In a systematic selection protocol, samples are distributed in a uniform, evenly spaced grid. In a random selection protocol, samples are distributed randomly.
The allocation strategy refers to how your samples will be allocated within your strata and/or clusters (or your area of interest as a whole if neither strata or clusters were used).
Popular allocation strategies include an equal allocation, a proportional allocation, and a hybrid allocation.
Let's assume we used a stratified sampling design to explain each allocation strategy. In an equal allocation strategy, an equal number of samples are distributed in each strata.
In a proportional allocation strategy, a number of samples proportional to the area of each strata is given (i.e. rarer land cover classes get less samples).
In a hybrid allocation strategy, the number of samples for each strata falls between the number of samples that would be allocated in an equal or proportional allocation.
The number of samples you should collect depends on how precise you want your accuracy assessment to be.
The response design refers to the process that leads to the determination of the reference classification of each sample. This process consists of the following components: the spatial unit, the source of information used for the reference classification, and the labelling protocol.
At each of our samples, we must determine how large of an area we collect information for. This is referred to as the spatial unit and can be a point or a polygon.
The source of information used for the reference classification is a very important part of accuracy assessment, as ideally, it will represent the “truth”.
EO scientists either use field surveys to obtain ground truth information or use high-resolution satellite imagery to obtain the reference classification. Both approaches have their pros and cons.
After determining your sampling and response design, all that’s left to do is to collect ground truth information for each one of your samples!
Once you have your reference classification for each of your samples, you are ready to conduct your statistical analysis. This consists of comparing the reference classification to the map classification at each of the samples. From this, you can construct a confusion matrix (aka an error matrix).
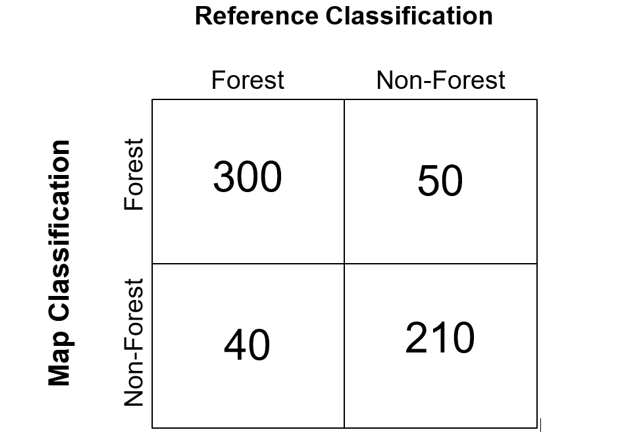
Different metrics can be calculated from the error matrix, such as total accuracy, precision, and recall. To explain the error matrix, let’s consider a simple case where we created a map of forest and non-forest, then collected 500 samples to assess the map’s accuracy
● 300 samples were correctly identified by the map as forest
● 50 samples were incorrectly identified by the map as forest
● 40 samples were incorrectly identified by the map as non-forest
● 210 samples were correctly identified by the map as non-forest
This accuracy assessment would result in the confusion matrix shown by the graphic below.

You can use Collect Earth Online, a free and open platform, to conduct your own accuracy assessment using Earth Observation imagery.
If you want to learn more about how to use the platform, you can register for the free course “Introduction to Collect Earth Online” right here on Geoversity.
Collect Earth Online can also be used to collect training data for a machine learning algorithm. Collect Earth Online is often used for this purpose – reference data can be collected on various land cover classes, which is then fed to a Machine Learning algorithm to create a wall-to-wall land cover map.
Collect Earth Online can also be used for near-real-time ecosystem monitoring. Using Collect Earth Online’s GeoDash tool, we can view satellite imagery from multiple sources side-by-side to monitor illegal deforestation.
This module was developed based on Dr. Pontus Olofsson’s publication "Good practices for estimating area and assessing accuracy of land change."
Collect Earth Online has received financial support from NASA, The U.S. Agency for International Development (USAID), SERVIR, the Food and Agriculture Organization (FAO), the U.S. Forest Service, SilvaCarbon, Google, and Spatial Informatics Group. It was co-developed as an online tool housed within the OpenForis Initiative of FAO.
Collect Earth Online was initially developed by SERVIR, and is now supported by a broad base of partners. CEO was inspired by Collect Earth, a desktop software developed by FAO. The development team includes Arthur Luz, Jordan Combs, Matt Spencer, Richard Shepherd, Oliver Baldwin Edwards, Sif Biri, Roberto Fontanarosa, Francisco Delgado, Githika Tondapu, Billy Ashmall, Nishanta Khanal, John Dilger, Karen Deyson, Karis Tenneson, Kel Markert, Africa Flores, Emil Cherrington, and Eric Anderson.