Remote Sensing
Earth from Space: Singing Dunes and Mysterious Lakes
4 min
The article "Why do you not see what I see?" raised eyebrows and triggered some discussion. It is, therefore, time for a follow-up and to unravel the colour composite.
Mixing independent intensity of red, green and blue on a display creates the sensation of colour for the viewer. Almost all personal systems we use nowadays, like mobile phones and television screens, allow us to display 224 individual colours because we can create 28 different intensities of individual red, green and blue, totalling 16 million colours (16.777.216 to be precise).
For a more detailed recap, see our previous article, "Why do you not see what I see?".
Let's leave aside whether humans can see 16 million different colours; the question is how do we use these in Remote Sensing?
Sensors come in many different designs, but the ones that are very useful for earth observation and land cover analysis are so-called multi-spectral or hyperspectral sensors. These sensors acquire radiation measurements in many predefined Electromagnetic spectrum ranges (spectral bands).
This article, "How do satellites work?" gives a brief introduction on the subject.
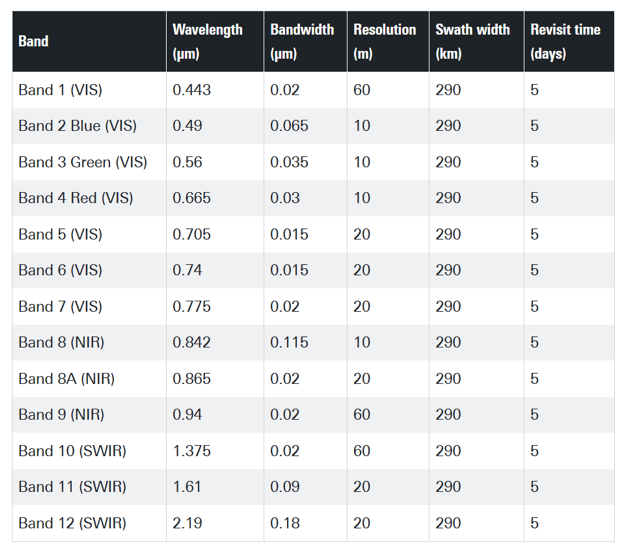
Preferably, the measured radiation directly comes from unique land cover objects and is not intermixed with radiation from other sources/origins/objects. These radiometric measurements are quantised into digital numbers with ranges from, e.g. 8 bit (28 guess why?) to, for example 16 bit (216). Below is an example of the sensor characteristics of the MSI sensor on board Sentinel-2 which measures with a 12-bit radiometric resolution.

Sentinel-2 MSI sensor characteristics. Source: ITC Satellite and Sensor database (https://webapps.itc.utwente.nl/sensor/getsat.aspx?name=Sentinel-2A, visited 18 July 2024)
Any object with a temperature above 0 Kelvin will reflect incident radiation, but depending on the composition and state of the material, reflectance in different parts of the electromagnetic spectrum will vary.
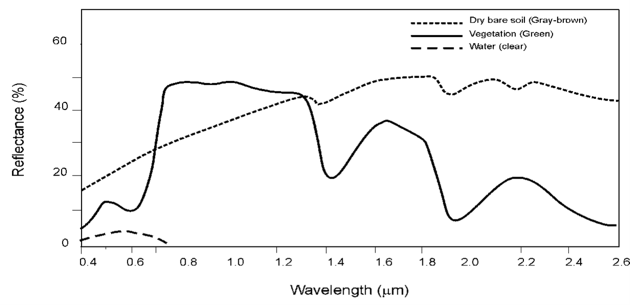
Thus, different materials have their own specific 'signature'. We can show the signature as a graph of wavelength against reflectance. In the following graph, you'll see typical reflectance curves ('signatures') for (clear) water, (green) vegetation and (Gray-brown) Dry bare soil.

Spectral signatures of the different objects.
The biggest hurdle to creating a useful colour composite is the selection of spectral bands because, despite the availability of dozens or even hundreds of spectral bands, you are limited to choosing only three: one to display in red (using varying red intensities), one to display in green and one to display in blue. Even with this limitation and using, for example, Sentinel-2 MSI image data, you can effectively create ![]() = 1716 different colour composites.
= 1716 different colour composites.
Which one to choose? How to choose?
To help you, you first should identify which objects interest you and find their signatures. Secondly, you analyse the signatures and identify the ranges in the electromagnetic spectrum in which these signatures vary most.
Next, you compare these ranges with sensor characteristics and select the three spectral bands matching the ranges.
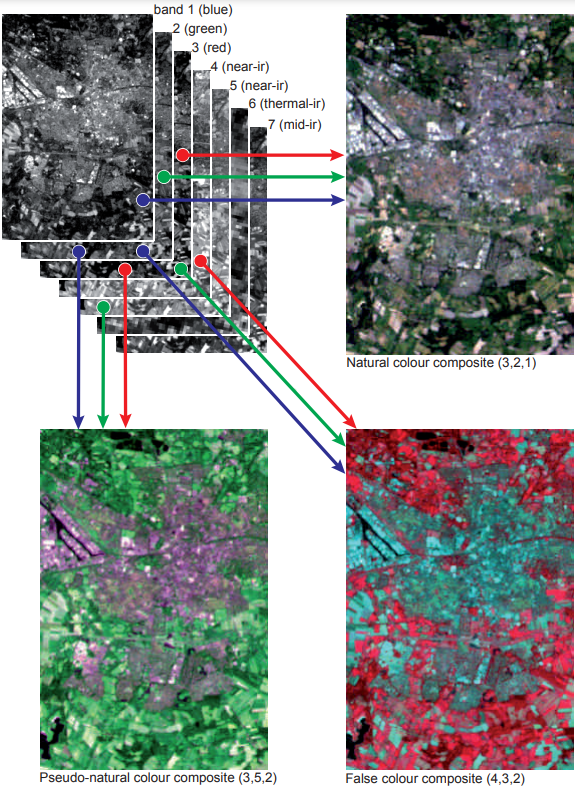
The final step is to decide which spectral band to display in red, which one in green, and which one in blue. If you prepare the colour composite for your next-door neighbour, you would probably go for a combination that they can make sense of without having your scientific knowledge and expertise, e.g., a natural colour composite.

Landsat 5 Thematic Mapper colour composite of Enschede and surroundings. These different colour composites are shown: true or natural colour, pseudo-natural colour and standard false colour.
For a fellow remote sensing specialist, it wouldn't matter as long as you inform them about the sensor and bands used; they should be capable of combining knowledge of additive colour mixture, sensor characteristics, and signatures for appropriate interpretation.
The apparent simple concept of a colour image in the context of remote sensing and earth observation requires an understanding of many different related concepts like additive colour mixture, spectral reflectance and sensor characteristics.
We have not yet explored how to interpret the colours in a composite or how to use and interpret contrast enhancement or the spatial resolution of sensors. Perhaps that requires yet another article?
Or sign up for a course at Geoversity or ITC e.g. the short course Remote Sensing and Digital Image Processing, in which these important concepts are introduced in the first module followed by a short but in-depth module on Advanced Image Classification.