Spatial Data Science
Symbols on maps and graphs and why choosing them carefully matters
4 min


Do you think visuals don't lie? Think again! In today's visually driven world, maps, charts, and graphs dictate how we interpret stories—often without us realizing it.
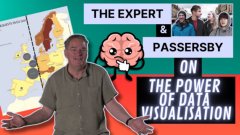
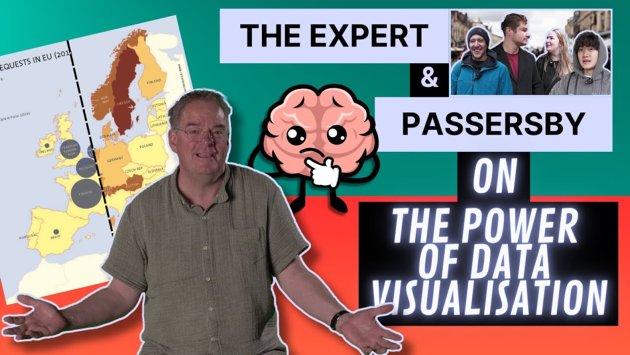
Data visualization expert Barend Köbben is here to break it all down. We hit the streets to see how people interpret visuals, and Barend explains why you might be getting tricked by your own brain, as well as the design choices of the mapmaker.
From biased maps to sneaky charts, this video explores the impact of design choices on how we construct stories from them.
Whether you want to become a sharper data reader or a skilled map maker, Barend's breakdown of these visual (unintended) tricks is a must-watch. Learn how to spot common mistakes and be inspired to create fair, transparent visual stories.