Food Security
How remote sensing helps us investigate extreme heat's effect on crop productivity
6 min


Agricultural yield is influenced by a multitude of natural factors including temperature, water availability, sunlight, and soil quality.
In view of ongoing global warming, there's an urgent need for knowledge and understanding of the specific impact of heat extremes on crop productivity.
Agriculture all over the world is increasingly challenged by high-temperature extremes. These extremes will likely worsen with climate change, even with better irrigation.
Previous lab experiments suggest that heat stress is a critical limiting factor of crop growth and development.
However, it's difficult to separate heat stress from other stresses like water scarcity in the field. Heat and water stress often occur together and can exacerbate each other, but the ways in which they impact crop productivity are physiologically and biochemically different.
It’s important to study heat stress as an isolated factor in order to understand its specific impact on crop growth.
From this starting point, researchers conducted a study aimed at understanding how multispectral remote sensing can help investigate the potential impact of heat stress on global food security.
Crop productivity can be measured by gross primary production (GPP), which represents the rate at which plants capture carbon during photosynthesis.
It's a known fact that high-temperature extremes slow down the photosynthesis process and reduce GPP.
Past events in Europe, Russia, and Southern China demonstrate this, where heatwaves were shown to reduce GPP significantly.
The new opportunity for investigating the heat stress effect in the natural environment are eddy covariance (EC) flux and remote sensing (RS) techniques.
EC flux provides accurate estimate of GPP, along with physiological and environmental information at a high temporal resolution, while RS offers promising perspectives on continuous spatial observation.
Vegetations indices (VI) from the RS observation are particularly useful for assessing plant growth and health.
By combining EC flux and VIs, researchers can isolate the effects of heat stress from other factors in the field and identify the most effective VIs for studying crop heat stress. Such knowledge can improve crop models by incorporating the optimal VIs in environmental constraints to make GPP estimations under heat stress more accurate.
The researchers developed an innovative approach to distinguish crop heat stress periods from normal growth conditions in croplands - independent of water stress and light limitation.
An important research objective was to investigate the ability of multispectral spectral bands and VIs derived from the Moderate Resolution Imaging Spectroradiometer (MODIS) to detect heat stress and assess its impact on GPP estimation for agroecosystems across the globe.
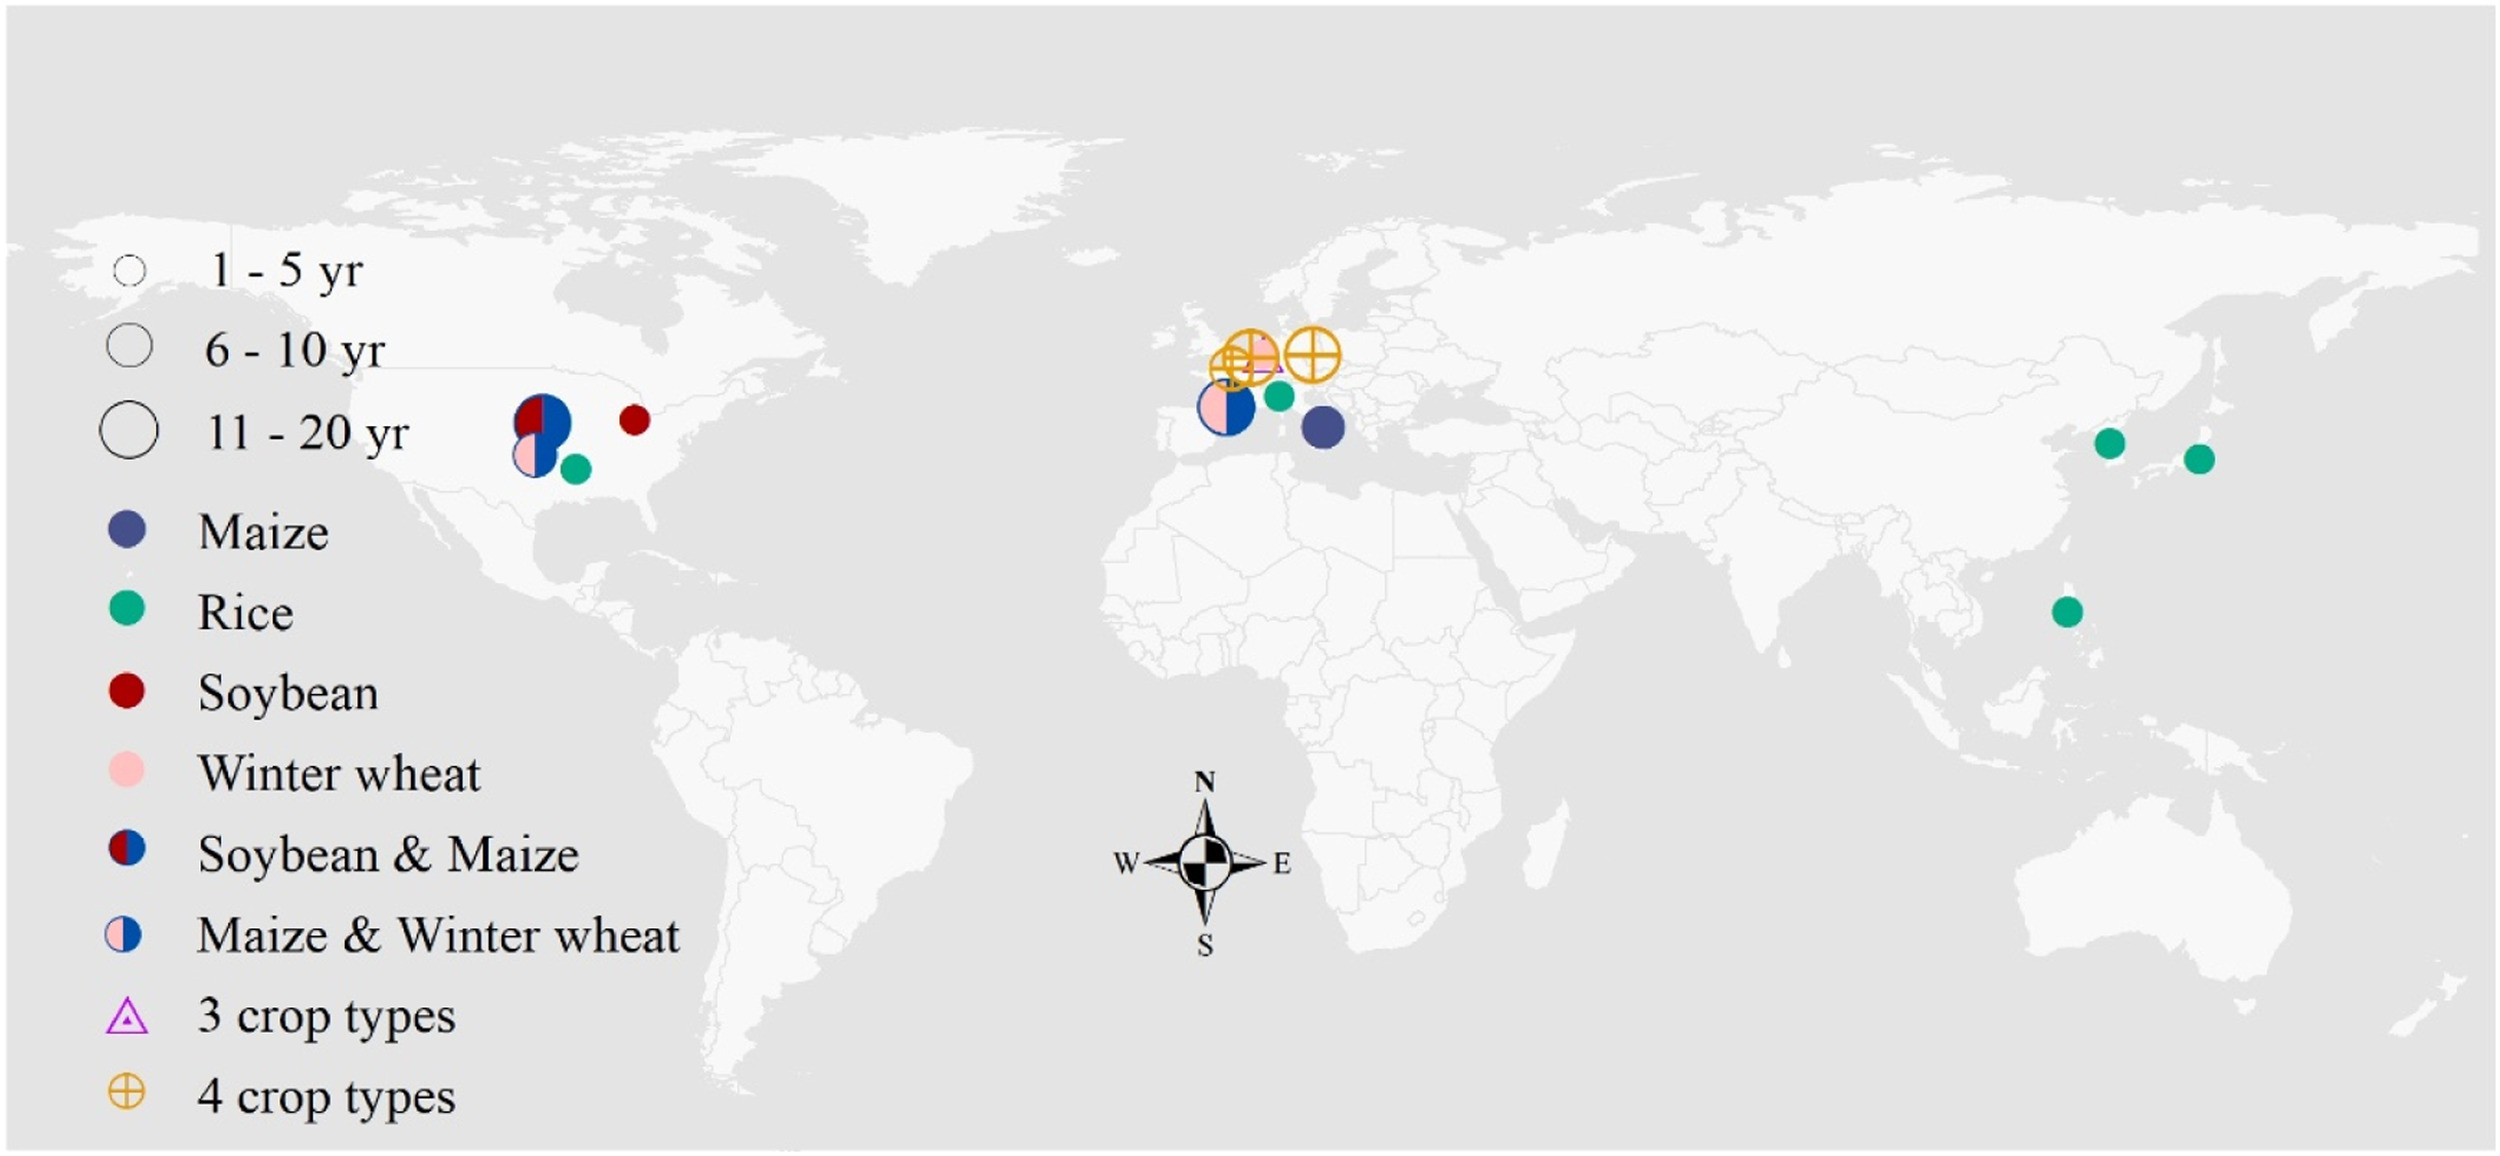
Thanks to an extensive EC dataset featuring data from 19 cropland sites across Asia, Europe, and North America, the researchers were able to isolate crop heat stress in field conditions.

An essential component of the study approach was the identification of heat stress periods. This was achieved in the following steps:
• Establish optimal temperature (Topt)
As the optimal temperature for photosynthesis varies across climate and location, the Topt for each crop type at each site was determined using GPP and air temperature in multi-growth seasons.
To ensure the Topt was achieved robustly, the researchers only used crop types planted for at least two growth seasons at each site.
• Define heat periods
"Heat hours" were defined as 30-minute periods in which the air temperature exceeds the Topt. If there were 12 or more heat hours in a single day, the day was considered as a “heat day”. A “heat period” was defined as three or more consecutive heat days.
• Eliminate the effects of unfavourable light conditions
Poor light conditions can lower GPP because photosynthesis depends on available sunlight. In this study, the researchers accounted for changes in light by examining how GPP responds to radiation during heat stress.
• Exclude samples affected by soil moisture stress
Research on soil moisture stress has shown that crops start to experience stress when soil moisture falls below about 80% of its full capacity. Samples affected by such soil moisture stress were not included in the study.
• Check the overlap between heat periods and normal periods
If two consecutive heat periods were less than six days apart, they were merged into one heat period.
Following this approach, the researchers identified 78 heat stress periods from 177 growing seasons across 19 sites with nine distinct crop types.
Remote sensing is widely regarded as a promising tool for detecting heat stress and evaluating its effects on crops. However, efforts to assess crop productivity under heat stress have often been hindered by the inability to isolate heat stress from other confounding factors.
The study addresses this challenge with an innovative method for identifying heat stress periods, effectively filtering out the impacts of water stress and light limitations.
While the method is based on observations in croplands, it can be adapted for other ecosystems, growth stages, datasets, and geographic regions. This flexibility promises to generate a rich library of samples for future research on heat stress.
The study demonstrated the effectiveness of MODIS multispectral remote sensing in detecting heat stress and assessing its effects on crop productivity.
As it turned out, the visible spectral region (especially the "red band") exhibited the highest sensitivity to heat stress. Additionally, vegetation indices amplified the reflectance differences between heat-stressed and healthy crops, with visible bands-based VIs exhibiting the highest discriminatory power. The study identified optimal VIs to estimate GPP under heat conditions.
Overall, this study advances remote sensing-based crop heat stress characterisation and helps science to understand how high temperatures affect crop growth.
The study findings can play a role in introducing heat stress effects in Earth system models for crop productivity prediction under climate change.
The researchers expect that their work will ultimately contribute to global food security.
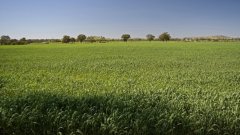
Header image: Bidgee, CC BY-SA 3.0, via Wikimedia Commons
This story is an adaptation of a journal article: Lai, P., Marshall, M., Darvishzadeh, R., Tu, K., & Nelson, A. (2024). Characterizing crop productivity under heat stress using MODIS data. Agricultural and Forest Meteorology, 355, 110116. It has been adapted with permission from the authors and in accordance with the copyright license CC BY 4.0
To view the original article, follow the link below: