


Big Geodata
Is It Even Possible to Protect Your Data Anymore? Here’s What Works Personally and Professionally
6:04
Spatial autocorrelation is a key statistical concept in Earth observation research. Remarkably, its importance tends to be overlooked. So what exactly does spatial autocorrelation entail? And why is it so important?
To understand the concept of spatial autocorrelation, it's important to first know what correlation is. 'Correlation' is the measure of the relationship between two variables. For example, a tall person is likely to weigh more than a short person. However, a tall person might also be lighter than a short person. The stronger the relationship between height and weight in any given situation, the stronger the correlation.
Autocorrelation occurs when something is correlated with itself. This can apply to either space or time, so there is spatial autocorrelation and temporal autocorrelation. To name an example of the former, when in a forest the temperature is measured at 10°C at a certain location, that measurement would probably be the same at 10 metres distance. However, at 200 metres from the original location, the temperature might be 12°C. In other words, observations very close to each other are likely to be more similar than observations further apart.
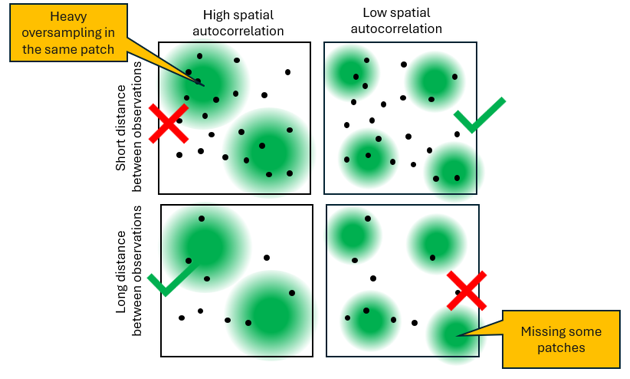
Where spatial autocorrelation is high, remote sensing images will show large patterns. This could be the case for large areas with similar measurements where changes are gradual, e.g. in primarily natural systems. Where spatial autocorrelation is low and changes are more sudden, e.g. in human-made landscapes, patterns will show a scattering of small areas with similar measurements. That spatial autocorrelation creates patterns in data is important when developing the models for whatever research you do.
Often measurements are carried out on the ground that are in a later step related to the measurements from a satellite image. For example the amount of grass biomass in an ecosystem can be related to how green pixels are in an image. If good relationships are found between those few observations and the satellite image, predictions can be made for all other locations in a satellite image that the researchers didn't visit. However, high spatial autocorrelation could lead to the same patch being sampled multiple times, when ground observations are not sufficiently apart from each other. That can generate the false suggestion of a strong relation between ground and satellite observations, even when there isn’t one. In order to get a fair representation, it's important to look at the spatial autocorrelation of the variable to be modelled.
Indicators of spatial autocorrelation can help to determine the minimum distance between observations needed for obtaining a fair measurement of the variation in the ecosystem. If observations are too close to each other relative to the autocorrelation in the variable that is considered, they're normally not independent and, therefore, not suited for statistical models. The level of autocorrelation typically varies between variables. For instance, biomass changes over shorter ranges than temperature or climatic variables. Depending on the phenomenon to be modelled, researchers need to ask themselves how large the sampling area should be and how far apart the samples should be to get a fair dataset to base models on.
Making decisions based on autocorrelation information improves model quality and makes models more generalizable. For instance, taking 100 samples in the same patch could allow for statements to be made about the relationship found in that patch, but it would remain unclear if such statements could be translocated to other patches as well. Sampling sufficient different patches allows to make more robust statements about the situation to be expected in disconnected but similar areas.
At ITC, the above is applied for example in species distribution modelling studies, where ocurrences of rare species are linked to environmental conditions. The strength of spatial autocorrelation in the environmental conditions is analysed, as is the extent to which that information influences the conclusions drawn for the model used. As a result, the models not only accurately predict where the species is, but they also show how important all the environmental conditions are, and which conditions are key.
Login and start learning!