


Remote Sensing
Earth from Space: Dhaka, Bangladesh
In any project using images acquired by satellite sensors or from UAVs, you will frequently display images to look at. Before even diving into technical issues that have an effect on the display, let’s first focus on what we think we have in common and under control: our own visual system.
Having two eyes enables us to see the 3-dimensional world around us. But each eye on its own has more to offer: colour vision. We think we understand how it works. Our eyes have a layer onto which three different types of sensors are attached, so-called cones. They are sensitive to three different but overlapping colour ranges from the visible spectrum: red, green and blue. For the time being we will exclude the rods which actually work only under low illumination.
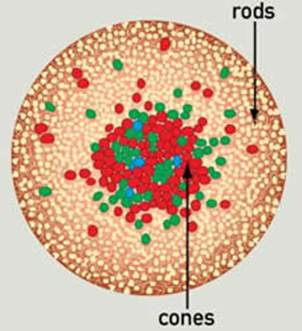
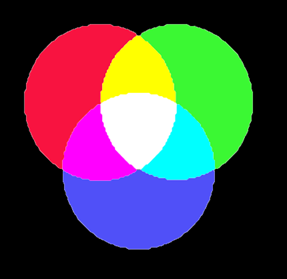
The measurements that these cones take give us the sensation of an individual colour of the rainbow by additive mixture e.g. red plus green gives us the sensation of an individual yellow wavelength. That all sounds straightforward, but there are still things that we don't know. How many of these sensors do each of us have? In what ratio? What is their distribution on the layer? Are they all working? Do we even know how the actual sensation builds up?
In real life I have frequent issues with my wife when I choose that nice green shirt to wear and she says, “No, that is blue”. Knowing the above, I cannot go into a discussion and claim that I am correct, because she might be right from her perspective. Additionally we were raised in perhaps different cultures by different parents. What if they meticulously told me that oranges are blue?
Now imagine you display a slide on screen and you would be able to zoom into a section on your display. You would see the individual LEDs emitting specific wavelengths. This is an enlarged portion of a slide on screen:
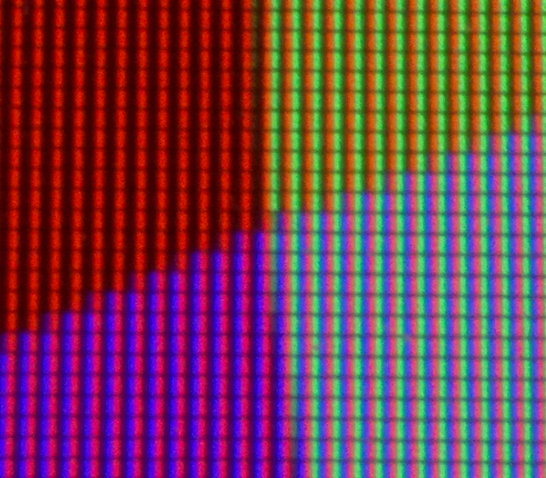
When you move backwards at a certain distance these individual LEDS are no longer discernible and the individual wavelengths emitted by these LEDs ‘suddenly’ additively mix to something new: what we sense as an individual wavelength. The above is a portion of the following slide. But which portion?
Because of the subjectivity of visual interpretation, we at ITC emphasise quantitative analysis using the actual values or measurements instead of visualised colours on a screen.
Another consequence of the potential ambiguity is that visual interpretation workflows should make use of example snapshots instead of descriptive or summarising colours. Which also enable the inclusion of other visual variables next to colour, like pattern, textures and size.
The CORINE Landcover database released in 1990 was based upon visual interpretation by multiple people in multiple locations using satellite image data. The colour composite (selection of spectral bands to assign to red, green and blue on display) was predefined, but to minimise interpretation subjectivity, all interpreters were provided an interpretation guide with actual examples of how to interpret the images.
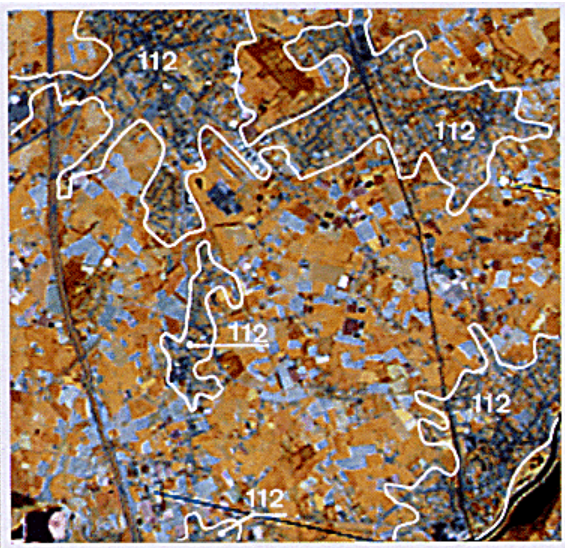
Image source: https://www.eea.europa.eu/publications/COR0-part1
So what does this all mean? It means that we can agree that we can both look at an orange orange, but we cannot guarantee we both see exactly the same. We take it for granted that we do.
That might not even be true for the actual sensing/measurement let alone what the person makes out of it. Compared to, for example, the physical measurement of incoming radiation onto the cones, our brain - being influenced by our environment and how we were raised - translates the measurements into a colour. And colours can even have different meaning in different cultures or circumstances. There is still a lot more to discover.
Thus, next time you show an image of your analysis to someone else consider that they might not see exactly what you see.
Login and start learning!